Prototyping Animated Spectral Images (ASIs)
Cite page (MLA): Kumari, Ashanka, et al. "Prototyping Animated Spectral Images (ASIs)." In Livingstone's 1870 Field Diary. Adrian S. Wisnicki and Megan Ward, dirs. Livingstone Online. Adrian S. Wisnicki and Megan Ward, dirs. University of Maryland Libraries, 2017. Web. http://livingstoneonline.org/uuid/node/af8d4263-1bd8-4a08-9155-642433fa2799.
This essay describes the background, objectives, workflow, and results of the development of animated spectral images (ASIs) for the present multispectral critical edition of Livingstone’s 1870 Field Diary.
Introduction Top ⤴
A variety of spectral image processing techniques arose from our work on a multispectral critical edition of Livingstone’s 1870 Field Diary. These techniques have allowed us to study the passage of the diary across space, hands, and time and, ultimately, to develop a detailed chronology of the manuscript based on the material evidence of the manuscript itself (see our six-part State of the Manuscript).
A by-product of this work is our creation of animated spectral images (ASIs). As we studied our images of the 1870 Field Diary manuscript, we soon recognized our need to highlight particular events in the life of the diary in a manner more dynamic than that possible through reference to static spectral images. This need led to the introduction of ASIs (in GIF format) as a tool for advanced manuscript study. This essay provides a brief introduction to these images and to this aspect of the project development.
Background Top ⤴
The work of imaging scientist Keith Knox, in the main phase of image processing (2014-16), led to our initial research into using ASIs. This research followed two trajectories.
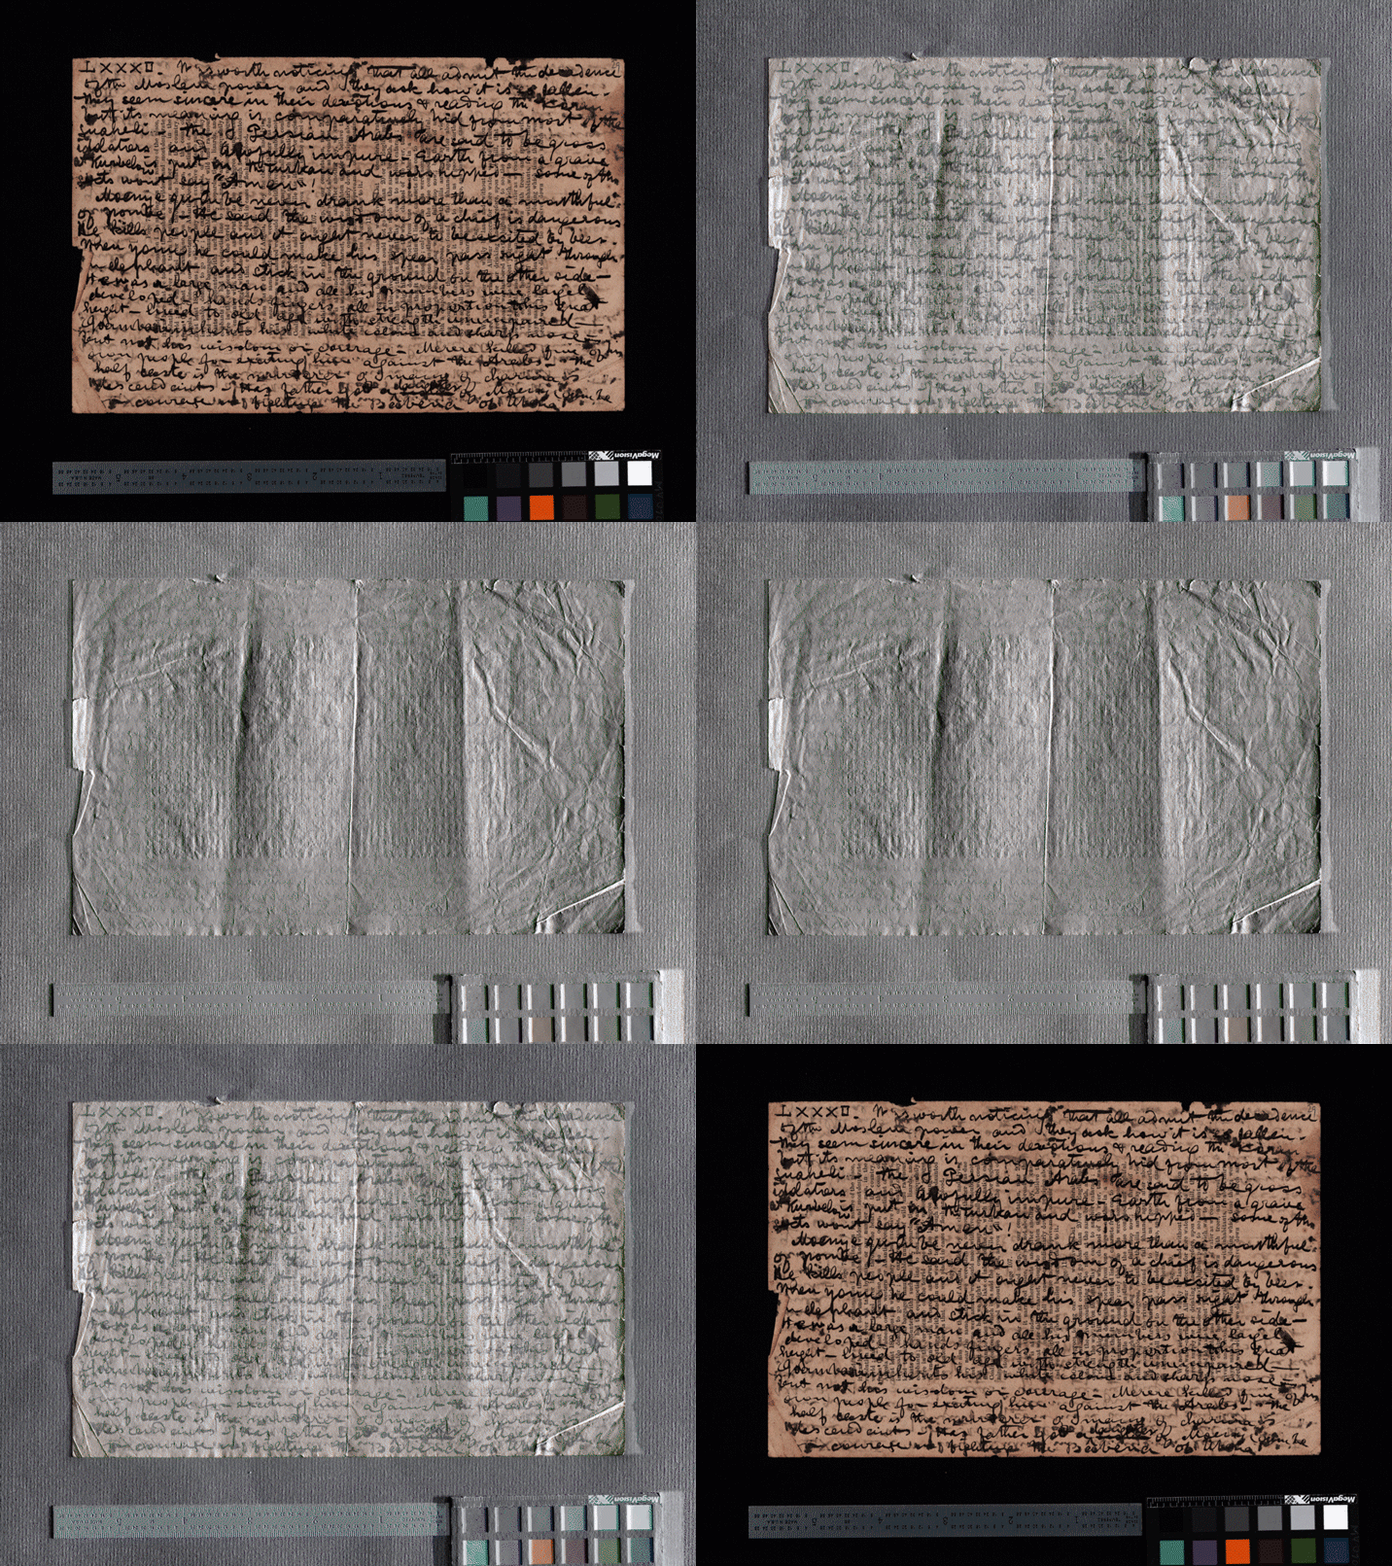
First, Knox developed a series of ASIs (color_raking) that explore the relationship between text and topography by peering beneath the surface of the writing on the page. These ASIs allow viewers to see features of the page that are not always visible in natural light. Generated using a custom script, each animation plays in an infinite loop, alternating between two images of each page: first, a natural light image shown in decreasing 10% increments of opacity and second, the corresponding spectral image, which has been processed to show the texture of each page.

Animated spectral image of a page from the 1870 Field Diary, second gathering (Livingstone 1871b:LXXXII color_raking). Copyright National Library of Scotland. Creative Commons Attribution-NonCommercial 3.0 Unported. The image shows the relationship between visible page features and underlying folds and creases.
Second, Knox also created sets of PowerPoint and PDF presentations that enable users to compare stain and smear alignment between two sides of a single leaf (overlaid) and that facilitate reivew of natural light and topographical images side-by-side (flipbook). He then transformed the latter into looping animations and, separately, also created new animations that move through longer sequences of pages, thereby foregrounding the progression of material processes across those pages (various).
Collectively, this work demonstrated the overall value of ASIs. Unfortunately, developing further ASIs did not fall within scope of our original NEH grant and, moreover, other processing needs also prevented further attention to ASIs during the main phase of image processing work.
Prototyping Objectives Top ⤴
Once that main phase ended, research assistant Ashanka Kumari, in collaboration with project director Adrian S. Wisnicki, determined to prototype an alternate technique for creating ASIs that would advance study of diverse material aspects of the manuscript and combine multiple spectral images in order to offer users a representation of material manuscript processes, such as liquid saturation or page discoloration, as they develop over time.
The spectral images produced for the multispectral edition of Livingstone’s 1870 Field Diary illuminate a range of the manuscript’s material characteristics. These include elements of composition, manuscript handling, and environmental impact as follows:
- Layering of written and printed text on the page (composition)
- Changes in the visual character of Livingstone’s ink (composition)
- Reinking of select passages in an alternate ink (composition)
- Manuscript folds, impressions, holes, and other damage (manuscript handling)
- Page discoloration and staining from multiple substances (environmental impact)
Once we had identified and studied these elements, we determined to create a range of representative ASIs, each focusing on one specific material characteristic. We wanted to foreground this characteristic in a manner that would be legible to users, efficiently combine static images into a dynamic visualization, and could be easily reproduced by our project team as well as others outside the scope of our project. Above all, we wanted to bring the material history of the diary to life in an exciting manner that demonstrated the individual and combined value of our new processed spectral images.
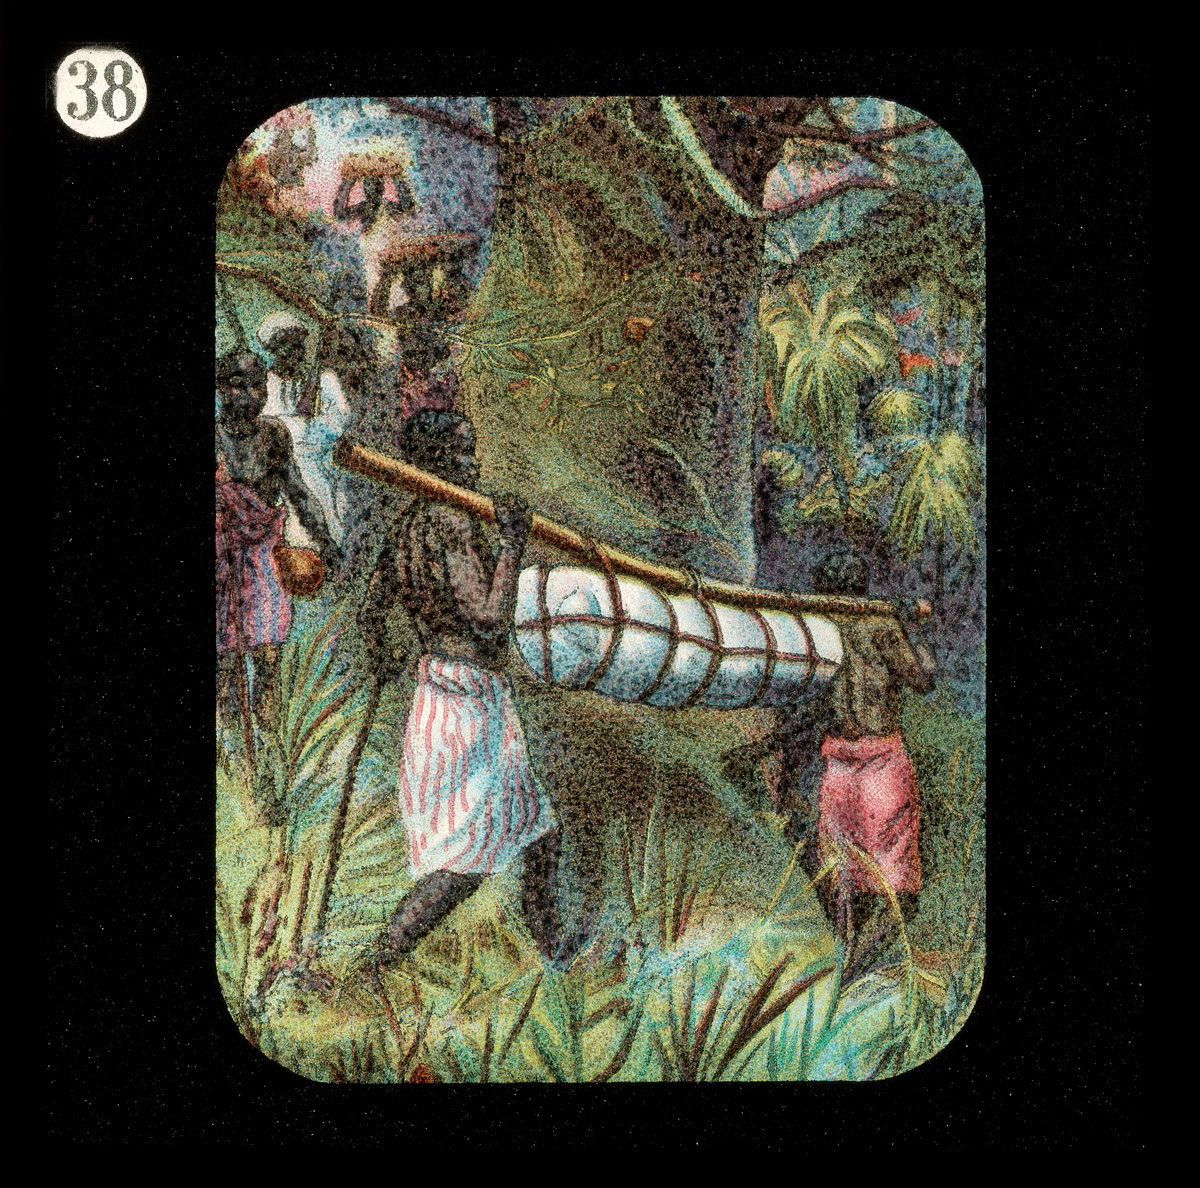
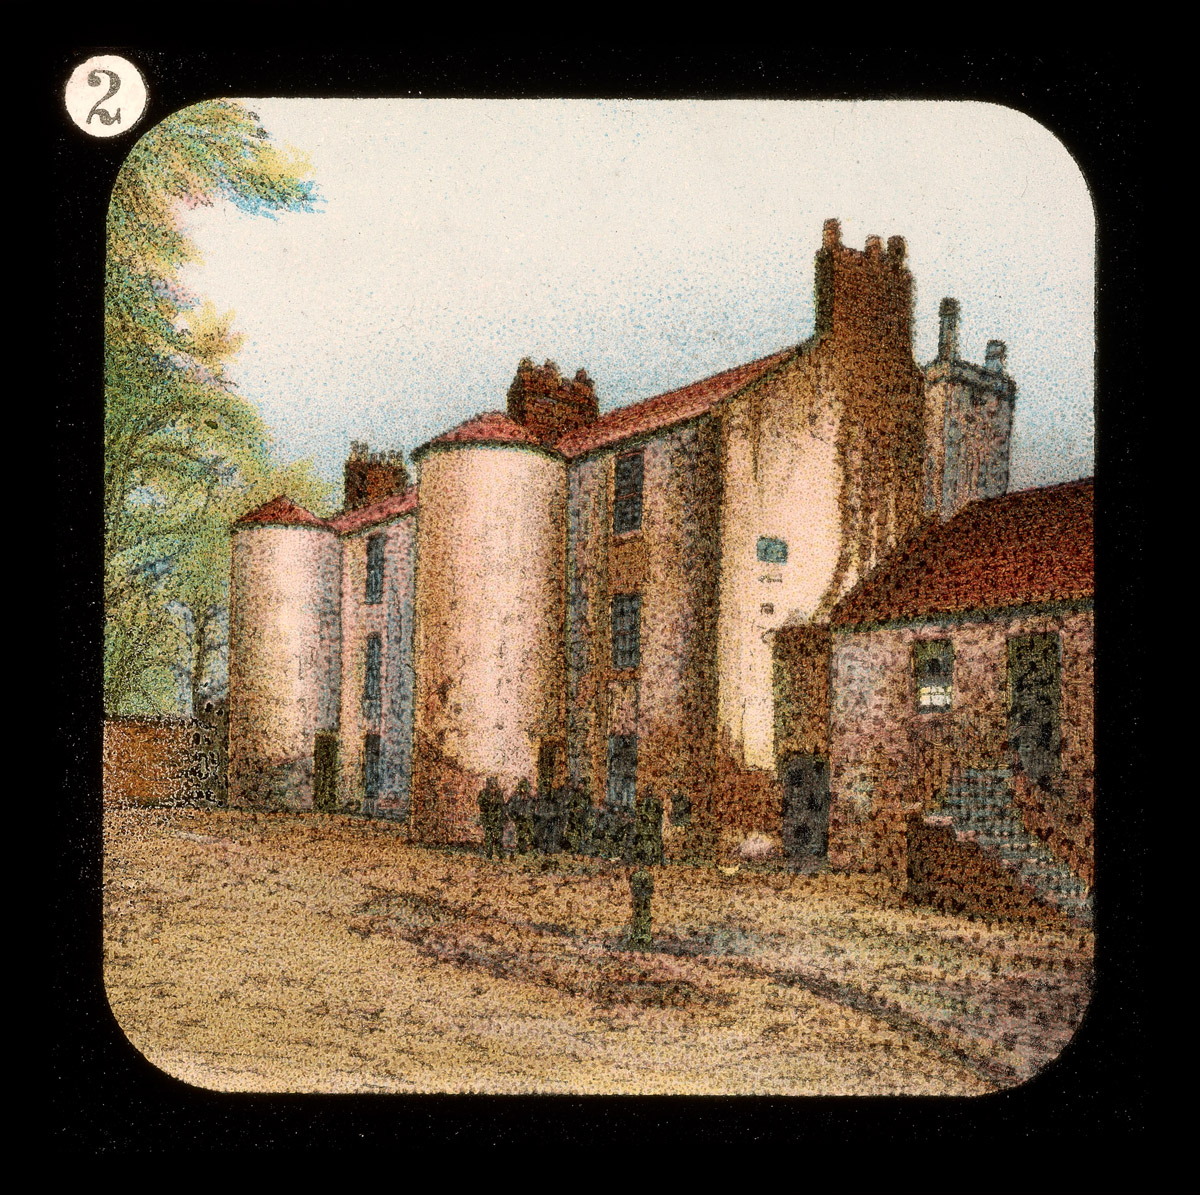
| Unknown creator, Lantern Slides of the Life, Adventures, and Work of David Livingstone, date unknown (c.1900). Courtesy of the Smithsonian Libraries, Washington, D.C. The 1870 Field Diary has passed through a variety of environments to reach the present day. In the nineteenth century (left, or top in mobile devices), Livingstone's attendants carried it along with the explorer's embalmed body from central Africa (now Democratic Republic of the Congo) to the east coast of the continent (now Tanzania). From the twentieth century to the present day (right, or bottom) portions of the manuscript have resided at the David Livingstone Centre in Blantyre, Scotland. |
Developing ASIs Top ⤴
Images in the Graphic Interchange Format (GIF), the format selected for our ASIs, are ubiquitous on the internet. The format has proven easy to create and share, is supported on different browsers, and plays on an infinite loop, thereby removing the need for users to iterate the animation. GIFs also have time as a vector, a feature that supports our goals of showing the evolution of the manuscript over time. Yet despite such advantages, GIFs are not ideal for high-resolution images such as ours and indeed GIFs best lend themselves to video clips rather than static photographs.
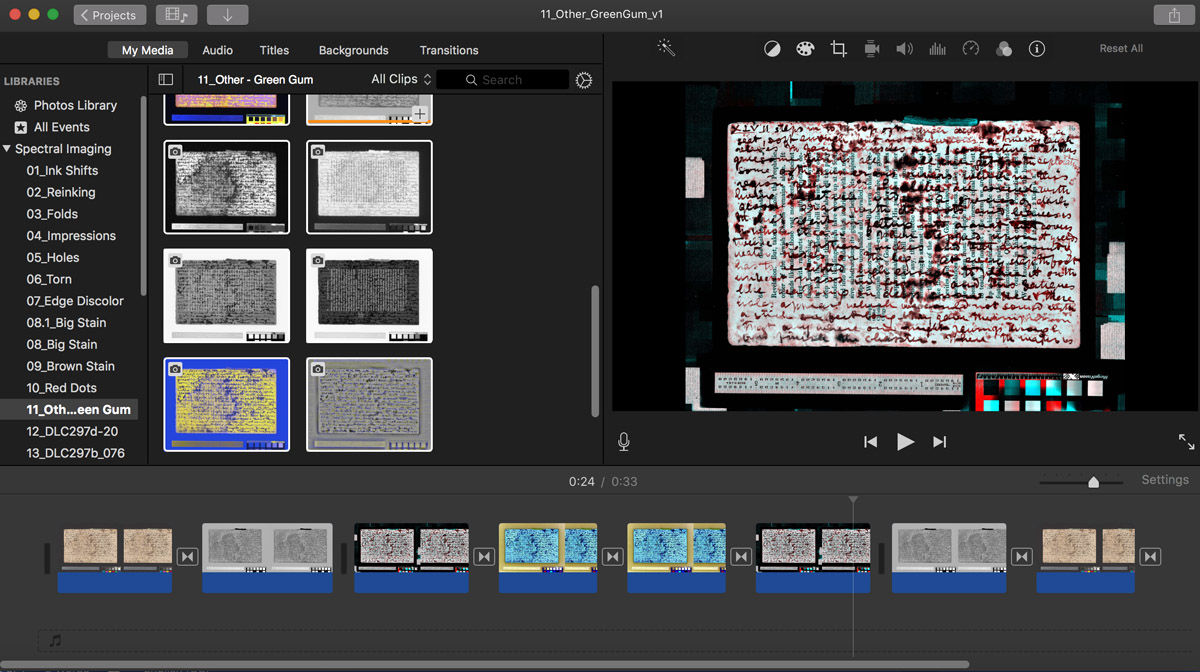
As a result, the initial stage of ASI development focused on identifying the software appropriate to the project needs. Kumari’s first attempts to create ASIs using online generators resulted in choppy GIFs that lacked smooth transitions between individual spectral images. As a result, she ultimately settled on iMovie, a free Mac-based tool that allows for the addition of transitions between images and modifications in timing, and can also generate numerous files, which better supports the batch processing needs of our project.

Screen shot of Ashanka Kumari's computer with 1870 Field Diary images arranged in iMovie. Copyright Ashanka Kumari. Creative Commons Attribution-NonCommercial 3.0 Unported
With the software selected, Kumari, in consultation with Wisnicki, developed the following workflow for creating the ASIs:
- Select a manuscript page and/or feature of interest for animated study.
- Review available spectral images available for the given page and choose images (ideally, three to five images) that best enhance the manuscript element selected.
- Experiment with image arrangement to determine best sequence of images for animation.
- Input images in order followed by images in reverse order into iMovie, add transitions, and set timing of transitions and image display.
- Export images as an MP4 file.
- Open the MP4 file with iMovie and alter the speed of the MP4 file as needed.
- Use an online MP4 to GIF converter to create the final product (required because MP4s don’t play on an infinite loop like GIFs do).
Overall, this workflow enables us to exert considerable control over the final product and to experiment with different image and speed permutations. The biggest disadvantages of the process are, first, the need to convert MP4s to GIF and, second, the amount of time needed to export the MP4s, especially when we include images with larger file sizes.
Results Top ⤴
Knox laid the groundwork for our development of ASIs by creating animations that linked text and topography of individual manuscript pages (forthcoming in January 2017) and by producing PowerPoint and PDF presentations that allowed for comparative study of features such as staining, smearing, and page surface:
- Flipbook: PDF (141.2 MB)
- Overlaid: PDF (110.6 MB)
- Bonus: Complete flipbook and overlaid PowerPoint and PDF presentations (503.5 MB)
Knox also developed animations based on the presentations and, separately, created new animations that targeted material processes in relation to longer sequences of pages:
- Flipbook: all pages of Livingstone 1870i:XXXIX-LV [v.2] (158.4 MB)
- Various: page versos of Livingstone 1870i:XXXIX-LV [v.2] (75.9 MB)
- Bonus: Complete flipbook and various animated sequences (308 MB)
Kumari successfully developed a repeatable technique for prototyping ASIs and produced a series of such images, each of which enhanced one or more manuscript features of interest as follows:
- Changes in the visual character of ink (59.1 MB)
- Reinking with an alternate ink (68.1 MB)
- Folds (41.6 MB)
- Impressions (41.8 MB)
- Holes (33.1 MB)
- Page discolor (46.5 MB)
- The big stain (58.8 MB)
- Red stains (40.2 MB)
Kumari also created additional sets of ASIs that focus on two specific pages of the manuscript, each of which combine a range of features of interest, including layered text and staining:
- Livingstone 1870h:XVII
- Livingstone 1871a:LXXVI [v.1]
- Layers of text (65.1 MB)
- Layers of text (reverse order) (42.2 MB)
- Stains (75.5 MB)
Bonus: Download all the ASIs of Livingstone's 1870 Field Diary developed by Kumari in a single ZIP file (685.9 MB).
The presentations and initial animations set the stage for creating the ASIs, which, in turn, are able to foreground manuscript feature(s) of interest while relying on only a handful of original static images. The ASIs also demonstrate the importance of the original spectral images – both individually and in combination – in highlighting the given feature. Finally, because of duration, the ASIs help underscore the role of change over time in producing the given feature.
As a result, the presentations, animations, and ASIs together realized and even exceeded all objectives for this aspect of project development. Additionally, the process for producing the ASIs developed by Kumari is straightforward and, although potentially time consuming, can be replicated in the future to illuminate additional features of the 1870 Field Diary manuscript, as well as other manuscripts enhanced with spectral imaging.
![Animated spectral image of a page from the 1870 Field Diary, second gathering (Livingstone 1871a:LXXVI [v.1]). Copyright David Livingstone Centre. Creative Commons Attribution-NonCommercial 3.0 Unported (https://creativecommons.org/licenses/by-nc/3.0/). Animated spectral image of a page from the 1870 Field Diary, second gathering (Livingstone 1871a:LXXVI [v.1]). Copyright David Livingstone Centre. Creative Commons Attribution-NonCommercial 3.0 Unported (https://creativecommons.org/licenses/by-nc/3.0/).](/sites/default/files/spectral-imaging/prototyping-animated-spectral-images-asis/liv_000208_0001_stains_fast-webpage.gif)
Animated spectral image of a page from the 1870 Field Diary, second gathering (Livingstone 1871a:LXXVI [v.1]). Copyright David Livingstone Centre. Creative Commons Attribution-NonCommercial 3.0 Unported. The animation combines a variety of spectral images to highlight staining on the page.


![Processed spectral image of a page from Livingstone's 1871 Field Diary (Livingstone 1871k:[5] pseudo_v1), detail. Copyright David Livingstone Centre and Dr. Neil Imray Livingstone Wilson: CC BY-NC 3.0 Processed spectral image of a page from Livingstone's 1871 Field Diary (Livingstone 1871k:[5] pseudo_v1), detail. Copyright David Livingstone Centre and Dr. Neil Imray Livingstone Wilson: CC BY-NC 3.0](https://livingstoneonline.org:443/sites/default/files/section_page/carousel_images/liv_013723_0001-new-carousel_0.jpg)


![Processed spectral image of a page from David Livingstone's "Retrospect to be Inserted in the Journal" (Livingstone 1870a:[3] pseudo_v4_BY), detail. Copyright National Library of Scotland and Dr. Neil Imray Livingstone Wilson: CC BY-NC 3.0 Processed spectral image of a page from David Livingstone's "Retrospect to be Inserted in the Journal" (Livingstone 1870a:[3] pseudo_v4_BY), detail. Copyright National Library of Scotland and Dr. Neil Imray Livingstone Wilson: CC BY-NC 3.0](https://livingstoneonline.org:443/sites/default/files/section_page/carousel_images/liv_000211_0003_pseudoBY_940_by_592-carousel.jpg)

![David Livingstone, Map of Central African Lakes, [1869], detail. Copyright National Library of Scotland: CC BY-NC-SA 2.5 SCOTLAND and Dr. Neil Imray Livingstone Wilson: CC BY-NC 3.0 David Livingstone, Map of Central African Lakes, [1869], detail. Copyright National Library of Scotland: CC BY-NC-SA 2.5 SCOTLAND and Dr. Neil Imray Livingstone Wilson: CC BY-NC 3.0](https://livingstoneonline.org:443/sites/default/files/section_page/carousel_images/liv_003006_0001-new-carousel_0.jpg)

